Analysing data from a LoRa performance test
2023/06/15What is LoRa?
LoRa (LOng RAnge) is a radio communication technique that is derived from Chirp Spread Spectrum technology. The use of this modulation technique allows LoRa radios to achieve a higher communication range whilst maintaining the lower power characteristics which are similar to the FSK (frequency shift keying) modulation physical layer based radios. Spread spectrum techniques also allow communications to be resilient to natural interference, noise and jamming as the generated signal is spread over a range of frequencies. The various settings we can change to adjust time-on-air for a packet are the bandwidth, spreading factor and coding rate.
The tests were ran with a SX1280 2.4GHz LoRa chip connected to an Arduino Nano. Everything was mounted on a custom PCB with a buzzer and 2 LED's for visual and audible feedback. The crude hot-glue construction was to insure the SMA connector did not detach mid-test and during transit, which was a bit of a pain.

Definitions
Chirp: A signal in which the frequency increases or decreases
Bandwidth: The range of frequencies which the chirp will cover
Spreading factor: The controlling factor of the chirp rate, the number of chirps used to represent a signal. Lower spreading factors mean faster chirps and thus a higher data transmission rate.
Coding rate: The error correction for data transmission, higher coding rate values means higher resistance to interference, but also higher transmission duration.
How do the tests work?
The tests worked by adjusting the different setting values for the LoRa chip. It is to be noted that not every possible setting value was adjusted, only a small portion of them.
The tests were conducted by one of the devices transmitting an epoch time value and the receiver checking the time difference to work out the transmission time, and saving that data to a file. We did this over a distance of 981m and both the transmitter and receiver had line-of-sight of each other.
The data that was recorded was:
- the incoming epoch
- the local epoch
- the delta epoch
- the bandwidth
- the spreading factor
- the coding rate
- the RSSI
- the SNR
Viewing the results from the tests
For anaylsing the results, I decided to use Matplotlib to graph out the different time differences for the various tests. This was fairly straight forward and easy.
def plot_multiple_test_data(full_test_data):
    for idx, test_data in enumerate(full_test_data):
        plt.subplot(4, 2, idx + 1)
        packet_number = list(range(len(test_data)))
        delta_epochs = []
        bandwidth = ""
        spreading_factor = ""
        coding_rate = ""

        for test_num in test_data:
            delta_epochs.append(test_data[test_num].get("delta_epoch"))

            if not bandwidth:
                bandwidth = test_data[test_num].get("bandwidth")
            if not spreading_factor:
                spreading_factor = test_data[test_num].get("spreading_factor")
            if not coding_rate:
                coding_rate = test_data[test_num].get("coding_rate")

        a, b = np.polyfit(packet_number, delta_epochs, 1)

        plt.plot(packet_number, delta_epochs)
        plt.plot(packet_number, a * np.asarray(packet_number) + b)
        plt.xlabel("Packets")
        plt.ylabel("Time difference (s)")
        plt.title(
            f"BW: {bandwidth}, SF: {spreading_factor}, CR: {coding_rate}, Avg: {mean(delta_epochs):.3f}s, Packets: {packet_number[-1]}"
        )

    plt.subplots_adjust(
        top=0.972, bottom=0.043, left=0.029, right=0.994, hspace=0.318, wspace=0.063
    )

    plt.show()
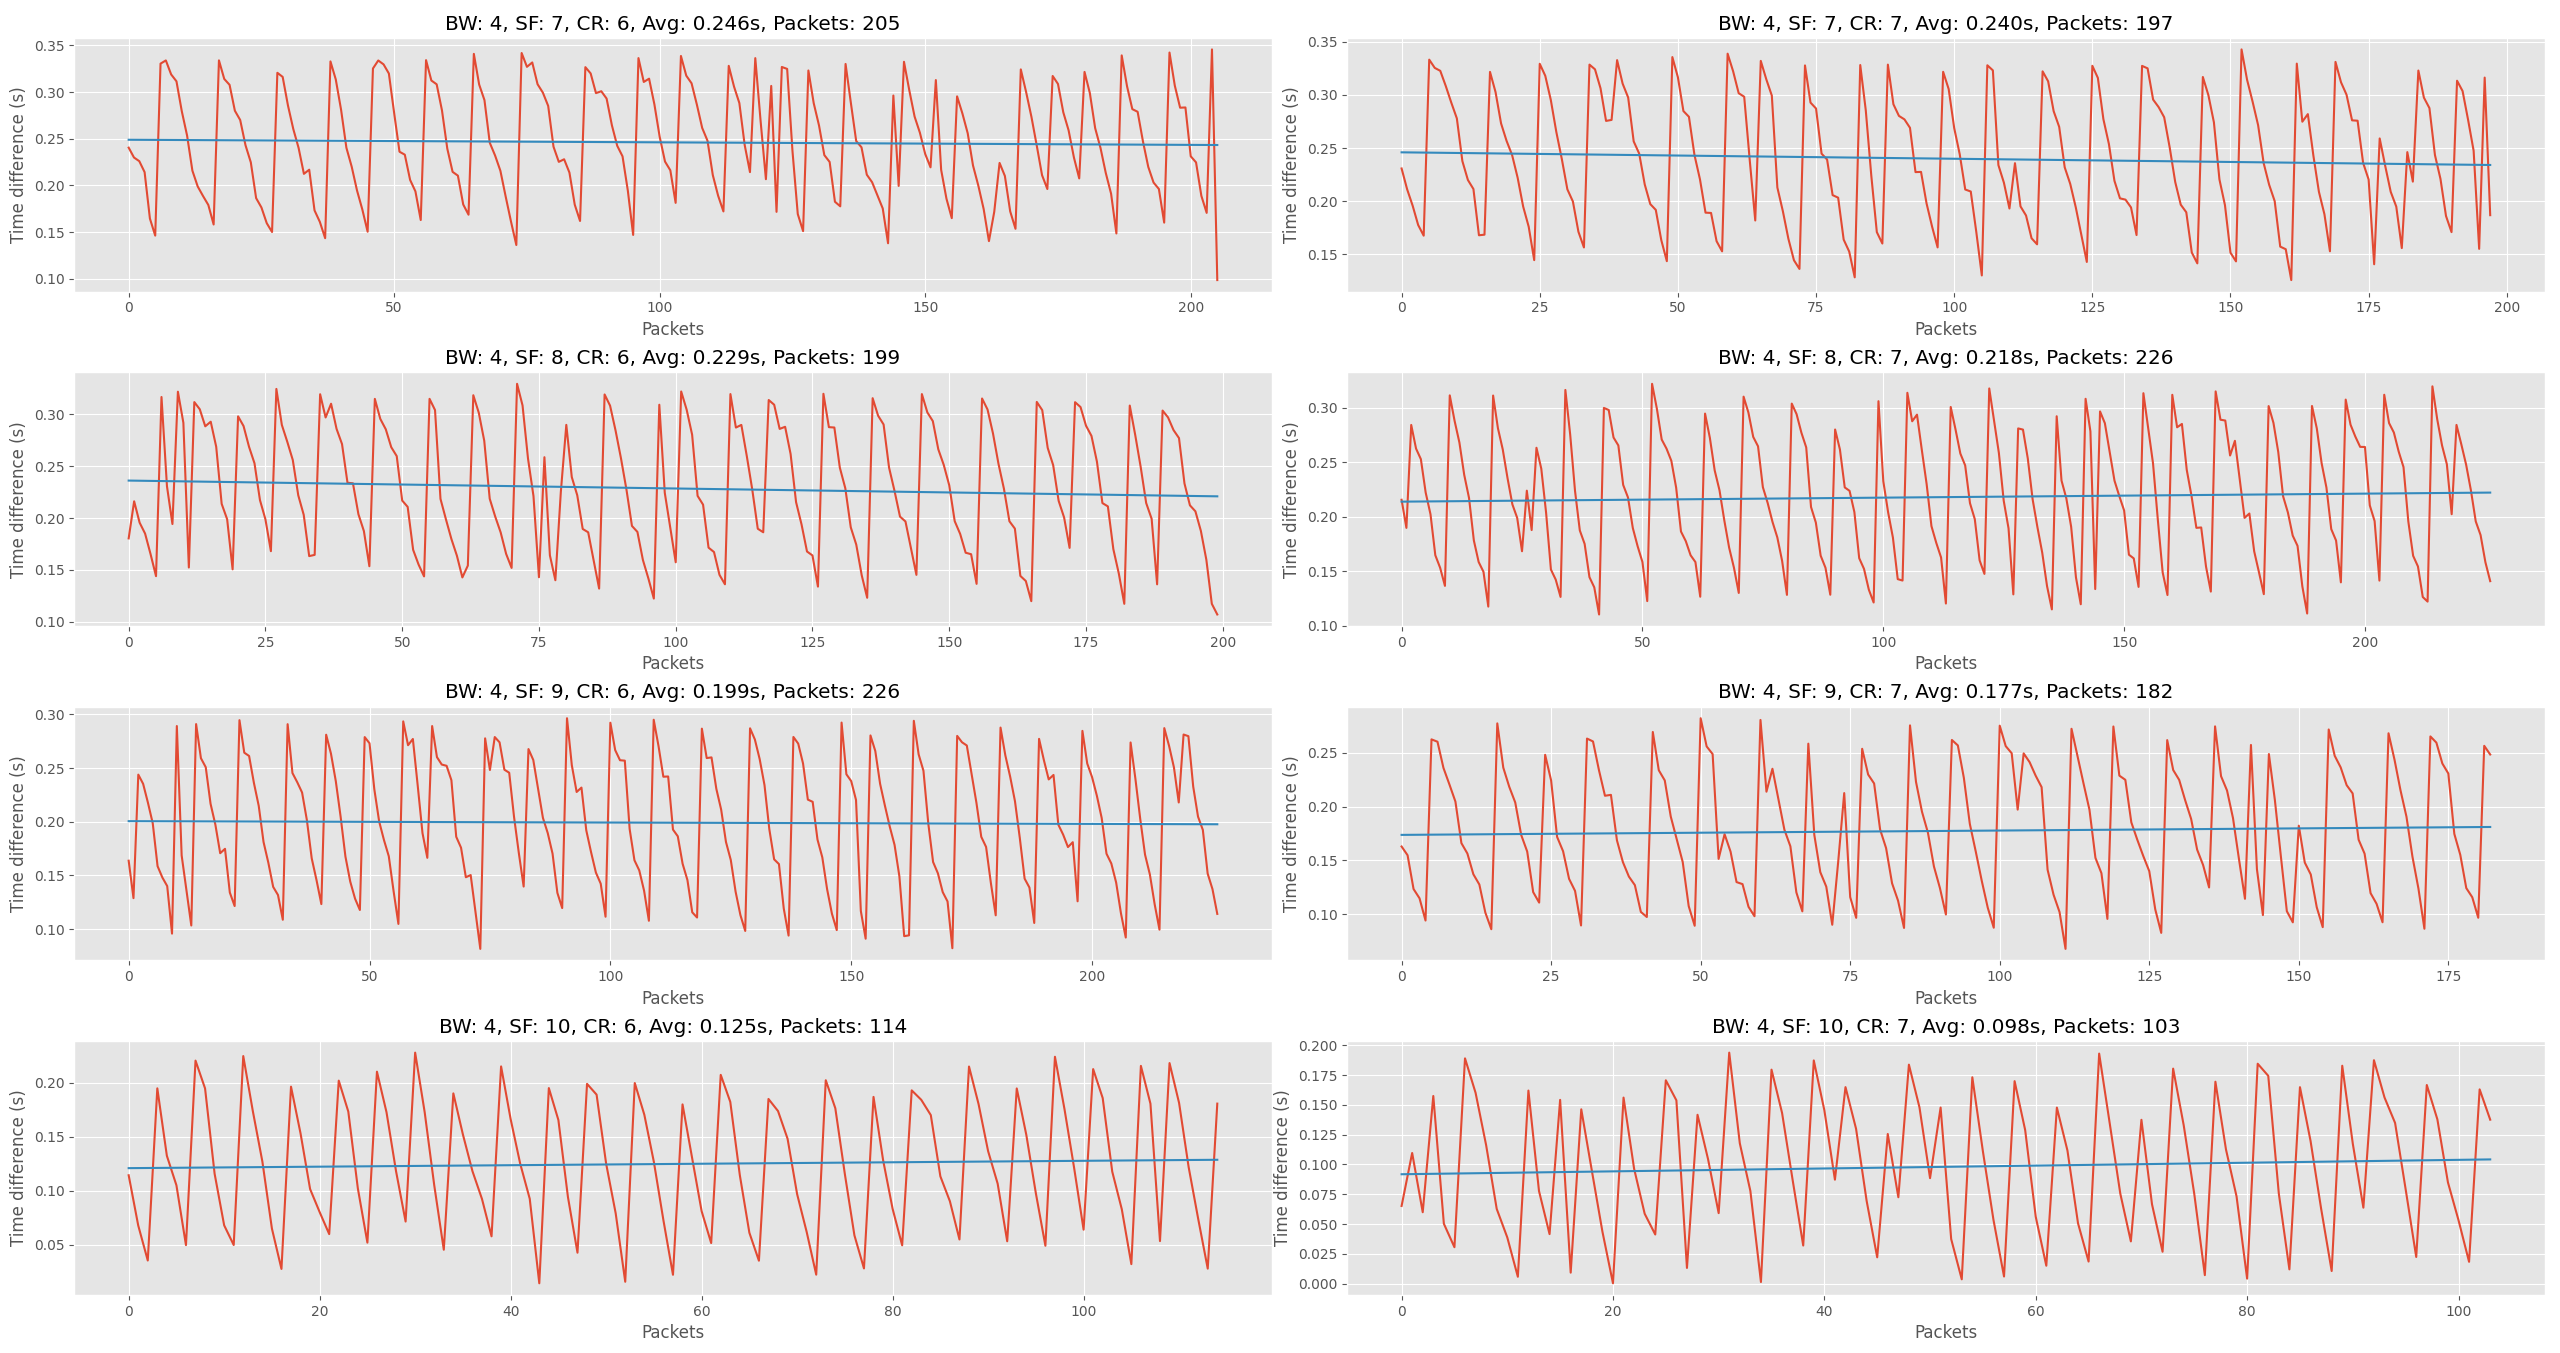
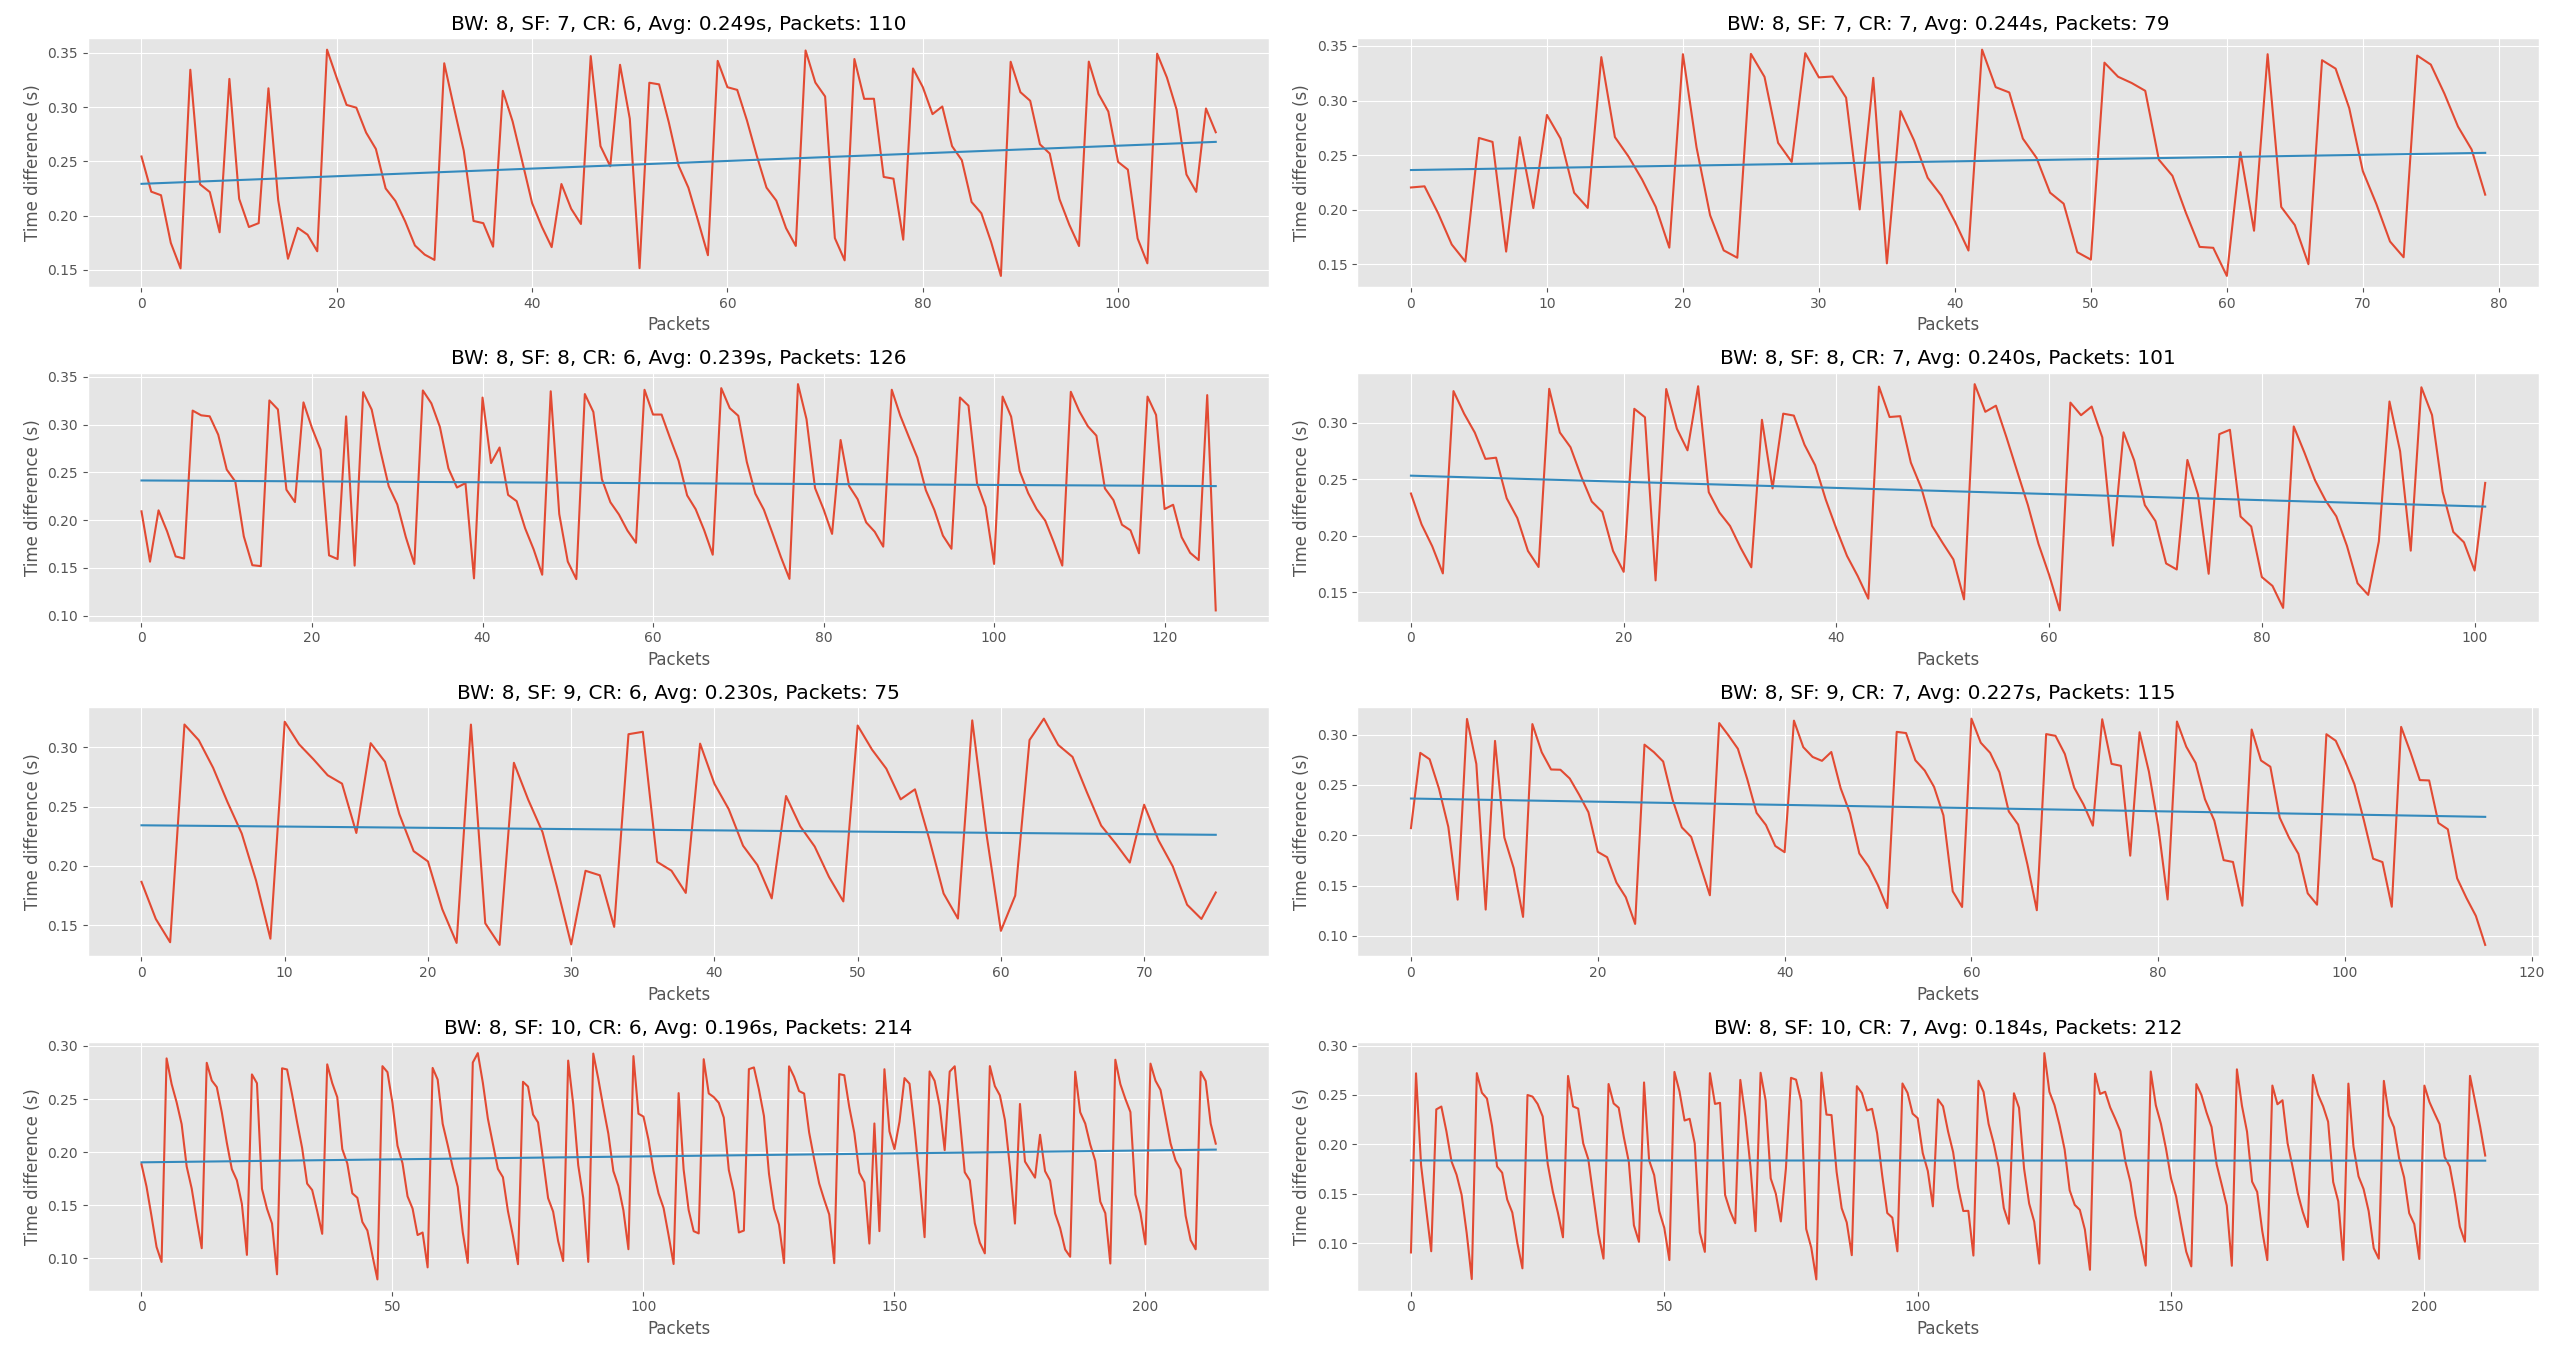
This function was used to generate a graph with 8 subplots, each of which had a different setting. The different values are collected into lists and then passed into matplotlib to plot on a subplot. Using numpy I was able to create a line of best fit for the data by using the polyfit function. I show the different setting values in the title of each plot, but also include the average transmission time and the total number of data points.
All the code which I used for this analysis is available here.
Graphs for the 8 tests with a bandwidth of 406250hz
Graphs for the 8 tests with a bandwidth of 812500hz
Conclusion
In conclusion from these tests, the best settings found for transmission time used a bandwidth of 4 (406250hz), spreading factor of 9 and a coding rate of 6. In the future I hope to conduct more tests with all of the possible settings for the LoRa chip, and at a range of distances (500m, 1km and maybe even 2.5km).
Please note: these test results are very specific to my use-case and may not be fully accurate as only one test was conducted.
Thank you for reading! 💖